

These quantities can be derived from the kinematics using the laws of
physics, specifically the Newton-Euler
equations:

Newton (linear): F = m.a (Force = mass x linear acceleration)
Euler (angular): M = I.a (Moment = mass moment of inertia x angular acceleration)
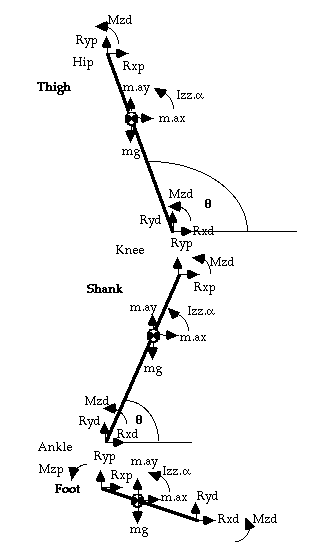
These equations describe the behaviour of a mathematical model of the limb called a link-segment model, and the process used to derive the joint moments at each joint is known as inverse dynamics, so-called because we work back from the kinematics to derive the kinetics responsible for the motion (fig. 1).
 This
is easily done when the motion is open-chain, with no resistance
to motion at the terminal segment, since all the kinematic variables are
known from motion analysis (in this case Rxd and Ryd
of the first segment in the chain, the foot, are both zero). When there
is contact of the limb with another object, such as the ground, or a cycle
pedal, the forces between the limb and the obstructing object in this closed-chain
must be measured. This is usually arranged by the technique of strain-gauging,
such as used in a force platform used to measure the ground reaction
force during walking and running.
Such a model is based on several assumptions, e.g.:
Whilst these are certainly not always valid for the human body,
they are nonetheless useful approximations in practice for many activities.
Rxp = m.ax - Rxd ... (1)
(where p = proximal, d = distal joint, ay = acceleration of segment centre of mass, CoM, in y direction;
Note that d = force platform when p = ankle)
from Newton, Sum of Vertical Forces, SFy
= m.ay:
Ryp = m.ay + mg - Ryd ... (2)
from Euler, Sum of Moments, SMz = Ia (where a = angular acceleration)
Mzp = Iz.a - Mzd - Rxp.rp.sinq + Ryp.rp.cosq + Rxd.rd.sinq - Ryd.rd.cosq(where rp = distance from segment CoM to proximal joint) (q = angle of segment to the right-hand horizontal)
or, using motion co-ordinates (more usual),
Mzp = Iza - Mzd - Rxp.(yp-yCoM) + Ryp.(xCoM-xp) + Rxd.(yCoM-yd) - Ryd.(xd-xCoM) ... (3)
where (xCoM, yCoM) are the co-ordinates of the centre of mass of the segment, (xp, yp) the coordinates of the proximal joint (xd, yd) the coordinates of the distal joint
It will be noted that several body segment parameters are required
to be known, such as the relative masses and mass moment of inertia
(or radius of gyration) of each segment, the positions of their
centres of mass. These are determined mostly from published cadaver studies,
though there now exist automatic techniques for their estimation in vivo.

| Segment | L
(%BH) |
Mass (%BM)
[Dempster] |
Child < 14 y
Mass (kg) [Jensen] |
%LCoM (%BH)
(from distal joint) |
Child < 14y
%LCoM (%BH) |
%I *
(in kg.m2) |
| Head | 9.6 | 7.8 | 23.8-1.14*age | 50 | 50 | 49.5 |
| Torso | 31.6 | 46.84 | 42.46-0.06*age | 50 | 40.13+0.18*age | 50.3 |
| Upper arm | 16.4 | 2.7 | 0.084*age+2.2 | 56.4 | -0.028*age+55.7 | 32.2 |
| Forearm | 13.7 | 2.3 | 0.015*age+1.2 | 55 | 0.19*age+56.1 | 30.3 |
| Hand | 8.2 | 0.6 | 50 | 29.7 | ||
| Thigh | 25.4 | 9.9 | 0.364*age+6.634 | 56.7 | 53.42+0.115*age | 32.3 |
| Shank | 23.3 | 4.6 | 0.122*age+3.809 | 57 | 55.74+0.3*age | 30.2 |
| Foot | 11.7 | 1.4 | 0.015*age+1.87 | 50 | 56.49+0.186*age | 47.5 |
For example, the ankle moment curve (fig. 2) indicates a negative (plantarflexor) moment throughout nearly all of stance, with a very brief and small dorsiflexor moment immediately after heel-strike. The curve tells us that the main muscle group active at the ankle throughout stance are the plantarflexors (tricpes surae), with steadily increasing activity through stance up to a maximum just before toe-off, shown in the video picture. Note that there is a range of values at each time interval - we don't all walk exactly the same! - the range shows the mean value ± 1 standard deviation of a selection of normal individuals..
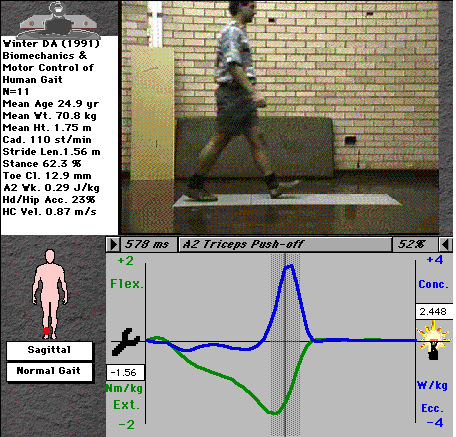
Fig. 2: Ankle moment during normal gait
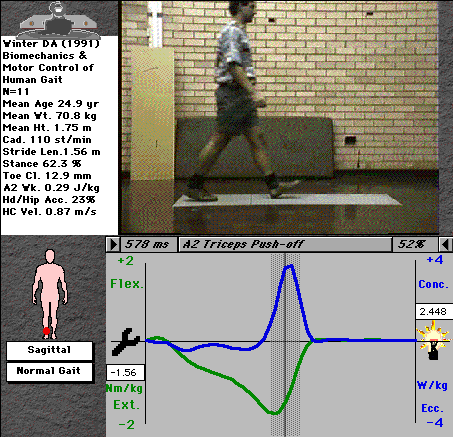
Fig. 3: Mechanical power at the ankle
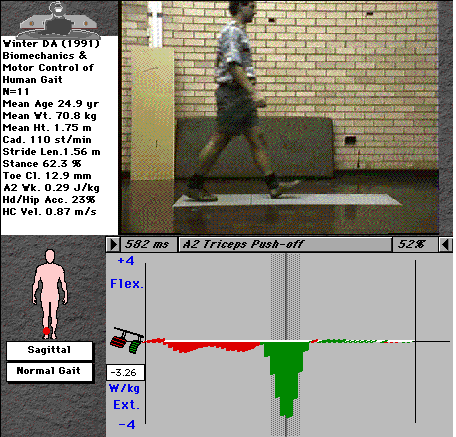
Fig. 4: Ankle joint activity
This chart shows us everything we need to know about the activity of the ankle joint musculature, clearly indicating the two distinct roles of the plantarflexors during stance. It also nicely shows the small eccentric contraction of the dorsiflexors (tibialis anterior and the peronei) immediately after heel-strike to control the foot as it lands, and their concentric contraction to lift the foot during swing.
Figs. 5 & 6 show the same plot for the knee and hip joints.
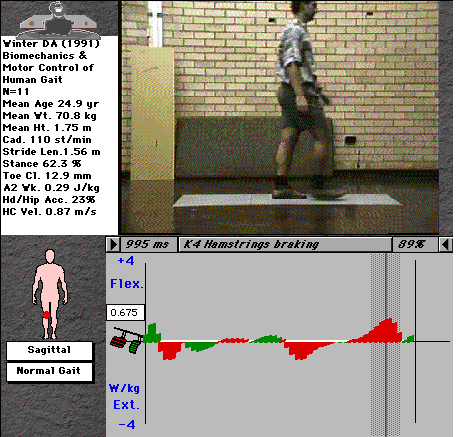
Fig. 5: Activity of the knee-joint musculature (cursor and video shown in K4 phase).
The knee shows 4 phases of distinct activity. K1 is the first eccentric phase and relates to quadriceps function during the loading response. K2 represents the same muscle group now acting concentrically to pull the trunk over the stance leg (about 10-15% of the forward energy of gait). K3 is an eccentric contraction of the quads to brace the knee against the strong contraction of the triceps (especially gastrocnemius, which tends to flex the knee as it contracts) at push-off. K4 is hamstrings braking of the leg during late swing, which increases greatly in running, when the leg swings forwards much more vigorously (with higher angular velocity).
The hip shows three rather small contractions (though there is considerable variation in hip function in normal individuals). H1 is a so-called push-from-behind caused by the gluteus maximus and hamstrings. It may contribute a small amount of forward energy, but is mainly used to stabilise the trunk at heel-strike. H2 is an eccentric burst to retard the backwards rotation of the thigh during stance, and H3 is so-called pull-off, coinciding with ankle push-off. H3 is also very much increased in running.
J.P. Holden, J.A. Orsini, K.L. Siegel, T.M. Kepple, L.H. Gerber, S.J.
Stanhope, Surface movement errors in shank kinematics and
knee kinetics during gait, Gait & Posture 5 (3) (1997) pp.
217-227.
J.P. Holden, S.J. Stanhope, The effect of variation in knee center location
estimates on net knee joint moments, Gait & Posture 7 (1)
(1998) pp. 1-6.
K. Manal, I. McClay, S. Stanhope, J. Richards, B. Galinat, Comparison
of surface mounted markers and attachment methods in
estimating tibial rotations during walking: an in vivo study,
Gait & Posture 11 (1) (2000) pp. 38 - 45.
M. Brown, S. Stanhope, Preventing Implementation And Tracking Errors
From Becoming Clinical Judgement Errors In Functional
Movement Analysis, Gait & Posture 3 (2) (1995) pp. 88-88.
P.S. Fairburn, R. Palmer, J. Whybrow, S. Fielden, S. Jones, A prototype
system for testing force platform dynamic performance, Gait
& Posture 12 (1) (2000) pp. 25 - 33.H.S. Gill, J.J. O'Connor,
A new testing rig for force platform calibration and accuracy tests, Gait
& Posture 5 (3) (1997) pp. 228-232.
R Baker, J Linskell, S Fairgrieve, M Warren-Forward, A spot check to
ensure the quality of matching of kinematic and kinetic data
collected during clinical gait analysis, Gait & Posture 3
(4) (1995) pp. 282-282.
R. Baker, The _Poker_ Test: A Spot Check to confirm the accuracy of Kinetic Gait Data, Gait & Posture 5 (2) (1997) pp. 177-178.
Bobbert and Schamhardt, J. Biomechanics, v23, 7, 705-710, 1990
Jensen RK. Changes in segment inertia proportions between 4 and 20 years. J Biomech. 1989;22(6-7):529-36.
Like to know more, or criticise my methods? Email me!  kirtleymd@yahoo.com