 Case
of the Week, 30-3-98: Calcaneal Lengthening
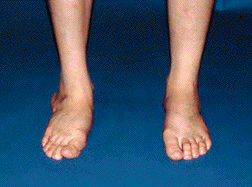
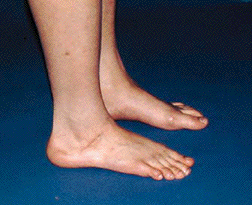
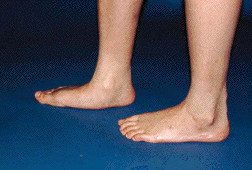
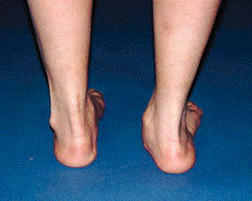
Diagnosis: Right planovalgus foot


History: 15 + 2 y/o female who underwent a R calcaneal lengthening (6/95), L calcaneal lengthening and TAL (1/96) and is now returning without having resumed full activity and is concerned with the marked planovalgus deformity of the right foot.
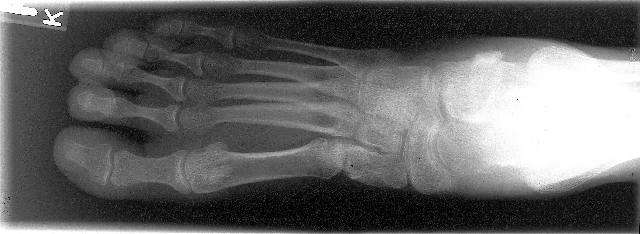
Pre-op radiographs
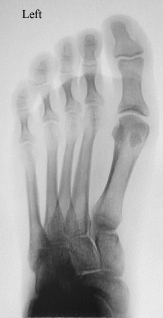
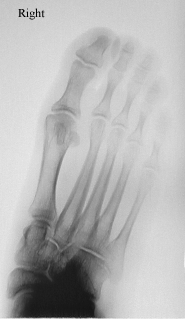
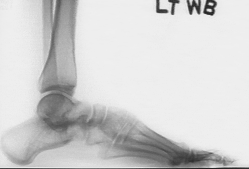

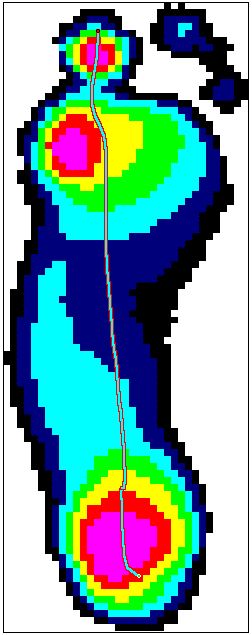
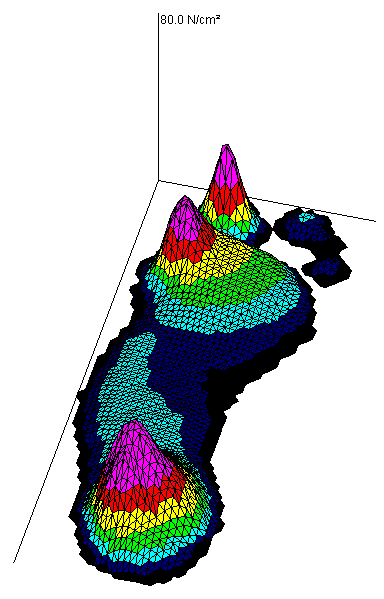
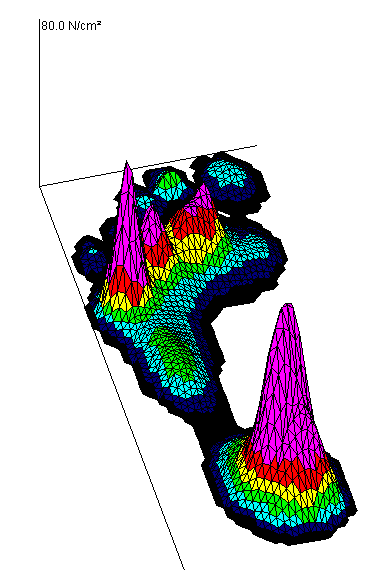
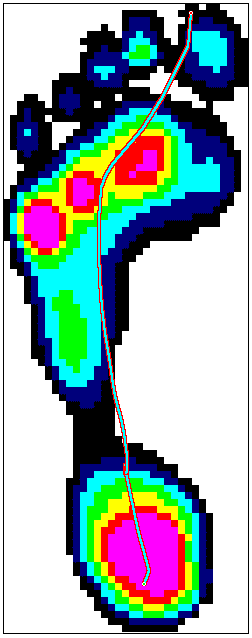
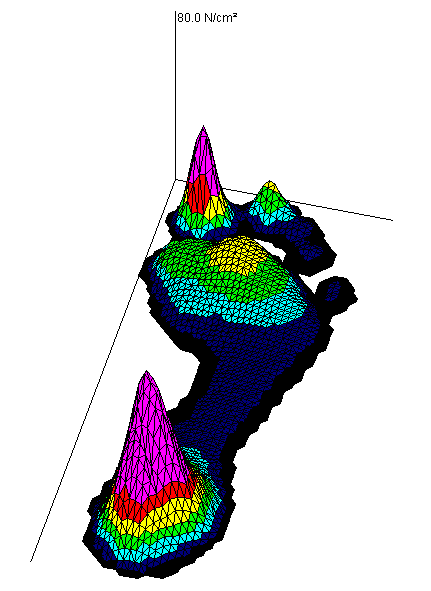
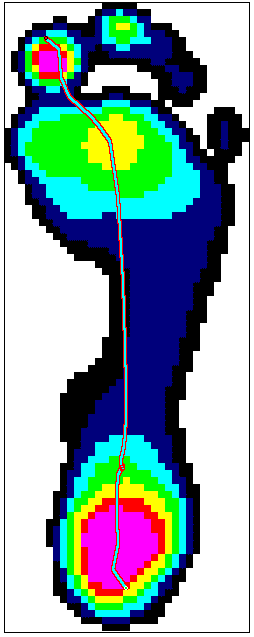
Summary: Dynamic foot pressure was analyzed for distribution and path of center of pressure. Additional analysis included geometric calculation of the arch index in order to quantitatively document the effects of the revision calcaneal lengthening of the right foot. Bilaterally she exhibits a momentary reversal in the center of pressure during the third rocker as the forefoot begins to load. This might suggest some anatomical/mechanical event occurring in the feet as the her center of mass is transferred to the single limb.
PROTOCOL: Data captured during barefoot walking on a 10m runway
using an EMED platform. Plots indicate maximum pressure applied
to each cell throughout the stance phase of gait and the blue line represents
the center of pressure plotted for each frame of data collection.
Data is averaged over multiple trials (Left n=3; Right n=3).
![]()
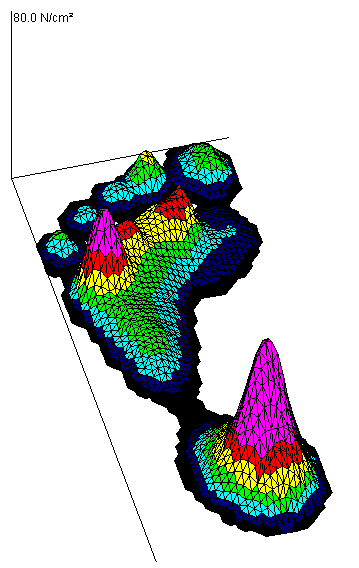
LEFT: The overall pressure distribution of the left foot
indicates that the individual maintains a supinated position throughout
stance and all rockers are evident. As a result the center of pressure
path is shifted laterally and the forefoot is loaded under the 5th, then
4th, then 3rd and 2nd metatarsals heads with final contact occurring with
the 1st and 2nd digits. The high focal pressure under the 5th metatarsal
head is especially abnormal. Elevated pressures are also found under
the heel and the forefoot in general, while pressure on the great toe is
less than expected.
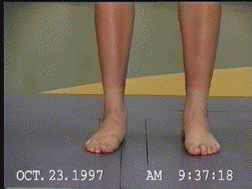
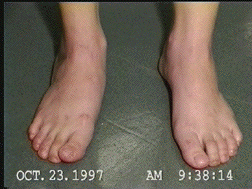
 (Click on image to see AVI video) ...Mac users may need to
RIGHT: Initial contact occurs on the lateral portion of the hindfoot but immediately the center of pressure is transferred medially as the first metatarsal region contacts the ground and loading begins. The 5th digit does not apply any pressure due to the medially shifted loading of the foot. There is a nice push-off occurring at the great toe and the diagnosis of planovalgus foot deformity combined with hallux valgus is evident in the overall pressure distribution. In the midfoot, areas of pressures are increased with higher pressures occurring medially. Other regions of elevated pressures are seen at the heel, under the first metatarsal head and the great toe.
Additional Analysis: To investigate the effectiveness of
the scheduled calcaneal lengthening in restoring the longitudinal arch
the geometry of the foot was looked at. Specifically the arch index
and the hallux angle were measured and will be compared with postoperative
analysis.
|
|
|
|
| Left |
|
|
| Right |
|
|
| Normal |
|
|
Post-op (10 months post-surgery, 10 months post pre-op analysis)
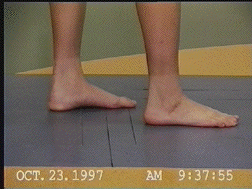
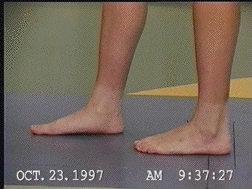
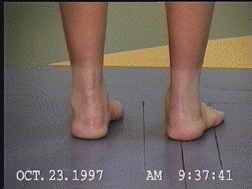
(Click on image to see AVI video) ...Mac users may need to 
|
|
|
|
| Left |
|
|
| Right |
|
|
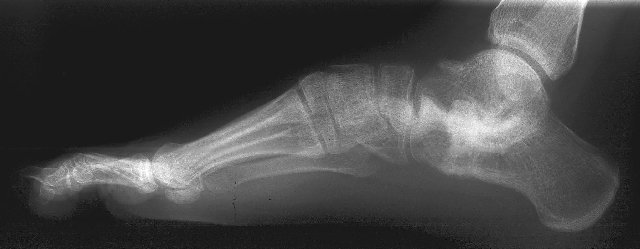
Post-op radiographs
Questions
Maintained by DDr.
Chris Kirtley, Andreas Kranzl & Dr.
Andreas Kopf
Last modified on Wednesday,
30-March-98.