Teach-in '98 on Coefficient of Variation: What people said...
Dear Chris,
A few years ago I published a paper in the Australian Journal of
Physiotherapy (1993, 39(2): 115-123) that described some of
my observations
on CV values of 10 gait variables: hip, knee and ankle joint angular
displacements; hip, knee and ankle moments of force; the support moment
of
force; and hip, knee and ankle joint powers. The study included
data from
10 subjects, including a below-knee amputee. I was particularly
interested
in how intra- and inter-subject CV values compared.
My results seemed to jive with Winter and what we see from Drs Cho and
Selber. Have a look at this web page that shows the main data
set for my
1993 analysis:
/CVData.html
The use of this particular form of the CV might be better thought of
as
being a "noise to signal" ratio as Dr Winter himself has often
said. In
this case, it does seem to be a reasonable value to use as an estimate
of
how consistent subjects are, either between sessions within themselves
or
between subjects. However, as is the case with any measure that
attempts to
distill a great deal of information into a single score, caution
in its sole
use is advised, at least as far as categorising variability in human
locomotion.
Cheers,
Drew
Andrew W. (Drew) Smith, PhD
Assistant Professor
Department of Rehabilitation Sciences
The Hong Kong Polytechnic University
Hung Hom, Kowloon
Hong Kong
Special Administrative Region of the People's Republic of China
Voice: +852 2766 7094
FAX: +852 2764 1435
WWW: http://www.polyu.edu.hk/~rs
ICQ: 6164882 Nickname: Daddio
EmailExpress: 6164882@pager.mirabilis.com
I've been meaning to send you this for some time but just haven't got
around to it.
(attached file is at: /data/Baker/anon.gcd)
This represents 9 adults, 6 females and 3 males (male physio students
are less common).
Each attended on two occasions. On the first occasion data was captured,
the markers
were completely removed and then replaced for a second data capture.
On the second
occasion only one marker placement was used. One walk from each marker
placement for
each patient was added to the normal database. Data from left and right
legs was
combined. One Physio (Brona McDowell) placed all markers.
Visual inspection suggests that the errors from different marker
placement are of the
same order as walk to walk and patient to patient variability
although we have not
analysed this any more formally. (Any suggestions as to how to extend
ANOVA
techniques
to the Coefficient of Variation or a similar measure?).
I think it is good practice to separate out left and right sides
in the averaging. We
inspected these visually and decided the differences were small. As
the main object of
creating the database was to display in the background of our clinical
data it seemed
more sensible to combine data from both sides.
All data was collected with six camera.VICON 370 system. Standard VCM
marker set was
used. All thigh markers were placed in the plane containing the
greater trochanter and
knee joint axis, this was judged by eye with the use of a mirror
to reduce parallax (ie
no use of either KAD or my correction algorithm). VCM was used to analyse
data with
ASIS-to-ASIS and ASIS-to-trochanter distances left blank (please note
that the term
"standard VCM analysis" can actually cover a range of biomechanical
models depending on
which parameters are left blank and which are filled in).
Force plate data was not captured. I have a feeling that by starting
off subjects at
the same point and only recording the walks on which they hit force
plates a fixed
distance from the starting point we are automatically selecting the
more repeatable
walks.
Cheers
Richard
Richard Baker
Gait Analysis Service Manager
Musgrave Park Hospital
Stockman'sLane
BELFAST
BT9 7JB
Tel: +44 (0)1232 669501 ext 2155
Fax: +44 (0)1232 611064
Dear All,
Just calculated Ricahrd's CVs for the sagittal-plane joint angles:
Hip 23%
Knee 18%
Ankle 53%
So, it certainly looks like the ankle is the most inconsistent joint.
Any ideas why? It's of interest (Winter, 1991, p 55-6) that EMG
conversely shows higher CVs for more proximal muscles: Soleus and
tibialis anterior have CVs of 31% and 33% respectively, while biceps
femoris and rectus have CVs of 62% & 51%.
So I would hazard a guess that this increased variation is arising from
the motion analysis system rather than the subjects themselves. Agree???
Chris
--
Dr. Chris Kirtley MD PhD
Dept. of Rehabilitation Sciences
The Hong Kong Polytechnic University
Hong Kong Special Administrative Region
of The People's Republic of China
Thought you might like to take a look at this data collected by
an undergraduate
student here a couple of years ago. He looked at repeatability
over a large number of
walks (nearly 50 for each subject). The markers remained
in place for all walks so all
variability is attributable to walk to walk variation for an individual.
Again no
kinetic data was collected so we didn't bias the data by only selecting
those walks
repeatable enough to hit the force plates.
You can see the data summarised in the table in terms of the average
standard deviation
over the gait cycle for each parameter for each subject. Interesting
to note that we
have comparatively high variability in sagittal plane at ankle,
knee and hip but that
at pelvis variability is greatest in the transverse plane.
We also calculated the average of the averages and plotted it against
age. You can see
the R-squared value of 0.54 is not particularly stunning but according
to my tables
just sneaks significance at the 5% level. The data suggests that the
variability
in a 6
year old walking is around twice that for a 12 year old.
Richard
Richard Baker
Gait Analysis Service Manager
Musgrave Park Hospital
Stockman'sLane
BELFAST
BT9 7JB
Tel: +44 (0)1232 669501 ext 2155
Fax: +44 (0)1232 611064
Hi Chris,
The variability of the ankle motion is likely due to its proximity
to the
foot. Since the foot has almost 9 times the number of
joints as compared to
the ankle, knee, and hip, it seems completely logical that the greatest
variation in ROM will occur at the measured site most proximal to it.
As I
have stated in our previous discusion from years past, modeling the
foot as a
single block does tremendous injustice to its complexity and significantly
alters the perspective of its relationship to the more proximal structures.
I have recently had a 24 month prospective
study of chronic lower back pain patients approved for publication.
This
showed how custom foot orthotic fabricated objectively using in-shoe
pressure
analysis produced dramatic improvement in long term outcomes as compared
to
standard care measures. The rate of relapse (previously published
at 70%) of
these patients was reduced to 16%. The reduction of pain was
50% greater and
the number of patients who experienced improvement was almost 45% greater
than
standard care measures (84% vs. 47%). Since gait labs worldwide
are
suffering from the financial crunch of dollars allocated to health
care
expenditures, their use for chronic back pain patients will be a very
significant boost. I would be happy to discuss this with you
in greater
detail. Looking forward to your response.
Regards,
Howard J. Dananberg, DPM
Dr. Kirtley,
Could you explain why you
"...guess that this increased variation is arising from
the motion analysis system rather than the subjects..."?
It seems to me that the CV at the ankle sould be naturally higher.
Winter's EMG results suggest that the control of gait is effected
more by
changes proximally. Smaller changes proximally should
result in
correspondingly greater changes in the position of the distal segments.
Given the small angular range of motion in the ankle and the likelihood
of
greater displacements due to the hip, it is not surprising that the
CV at
the ankle is greater.
I wonder if I am missing something that leads you to suspect this source
of
the high CV.
Why would you expect that the variation is more due to the motion analysis
system? I can appreciate a natural tendency to be skeptical of
experimental technique, that is indicative of a good scientist.
Am I
missing something?
Leon.
Leonard G. Caillouet
PhD Student, Louisana State University
Department of Kinesiology
15617 Shenandoah Square
Baton Rouge, Louisiana 70817
504-753-7471
Chris
I am interested to see that other labs are begining to adopt our
marker placement protocol, utilising a mirror. We have
been using
this technique since 1992, when we developed it to implement VCM
within our clinical service. We have in fact presented it at ESMAC
'97 in Basel (G&P, Vol 6 ,1997, pp263) as part of a validation
study, where we compared mechanical alignment of the knee between
VCM
and full length x-rays and showed that if knee rotation was
contained
to within +/-5 deg, alignment differences were approximately 2 deg.
This work is soon to be submitted for publication as a full paper.
As my contribution to this discussion I am sending an young adult
normal database of our own. Again, it is small, smaller, than
Richard's in fact (5 adults, 25 trials).
Data is at: /data
I will include the GCD file
and an Excel file (containing the COV info + the GCD data) in a
separate message. As you might expect the results are very similar
to
Richard's as the same marker protocol is utilised. The most obvious
difference is that his hip flex/extension is offset from ours into
extension by approx 10deg. This difference is made up of approx
5deg
from flatter pelvic tilt (maybe due to marker placement, but
maybe
due to age as a database of 50-65 yo we have has the same pelvic
tilt as Richard's group) and 5deg from a more extended knee
(we place
the knee marker on the anterior aspect of the lateral epicondyle,
which although leading to more flexion is a more consistently
palpable landmark).
With regards to COV, these are also similar but the obvious exception
highlights one of the weaknesses of COV. The COV for knee rotation
is
62 for Richard and 247 for us!! This is due to the very small values
we obtained for this variable (the SD is bigger than the value), due
to our experience with the marker protocol. When making up this
database we compared the graphs for a 3 subject (15 trials) database
and a 5 subject database (25 trials) and found that the graphs
(including SDs) superimposed. Unfortunately we do not have the COV
information to substantiate this.
I hope this proves that I am not agianst the idea of databases
sharing in princliple!!
Regards
Jeremy
Jeremy Linskell
Manager, Gait Analysis Laboratory
Co-Ordinator, Electronic Assistive Tehcnology Service
Dundee Limb Fitting Centre
Dundee, DD5 1AG, Scotland
tel +1382-730104, fax +1382-480194
web: http://www.dundee.ac.uk/orthopaedics/dlfc/gait.htm
Dear all CV analysers,
I'm pleased to tell you that Jeremy's data is now on the CGA Normative
Data page at: /data
The database is now growing into a useful resource thanks to the kind
support of our subscribers - thanks again.
I've had a couple of queries about my comments on CVs for EMG and kinematics
and kinetics. I think I haven't made it completely clear what I am saying,
so I'll try again.
Since:
a. The ankle is closest to the ground (most closed-chain joint);
b. Inverse dyanmics errors increase from distal to proximal as inaccuracies
in the ankle are passed on to the knee, etc.; and
c. The CVs for EMG of the lower-limb show the most distal muscles to
be least variable.
I would have expected the ankle kinematics and kinetics to also show
the least variablity (most consistency). In fact:
a. Ankle kinematics are most variable; and
b. Ankle kinetics are least variable.
How do you account for this seeming contradiction? My own interpretation
was that the kinematic variability must somehow be arising from the motion
analysis system. I suspect the foot segment markers are so close together,
and move so much on the skin, that they give rise to a lot of inaccuracies.
If you think the kinematic variability is not artifact and is a true
reflection of the biomechanics, please explain why the kinetics do not
also show high variability. Note, as support for my theory, that ankle
kinetics are almost independant of kinematics, being almost completely
determined by the ground reaction forces.
Chris
--
Dr. Chris Kirtley MD PhD
Dept. of Rehabilitation Sciences
The Hong Kong Polytechnic University
Hong Kong Special Administrative Region
of The People's Republic of China
I'm afraid I'm in the position of being able to send to but not receive
from the CGA
list. Hope I'm not repeating what anyone else might have said but that
hasn't made it
onto the summary of responses on the teach-in page of the CGA site.
I'm afraid I have to welly in with a major criticism of the use of
coefficient of
variation as a measure of repeatability. It isn't. It's a measure
of signal to noise
ratio and runs into real problems when there isn't any signal! It's
a very pretty 3-d
graph, Chris, but look at almost all the values in green and calculate
the mean signal.
It is very close to zero. The high values are coming not from a large
variability but
from a low mean signal. Note that it is the average signal value that
is used in the
equation so any parameter which shows left-right symmetry (pelvic obliquity
or pelvic
rotation) which should have a mean value of zero should almost by definition
have an
infinite cv. The presence of all those powers at the top end comes
from both inherent
variability in a measure which has been over-processed, and has picked
up all the
errors God put into gait analysis systems on the way, and the fact
that the mean power
at any joint tends to be quite low (presumably because! the it is energy
efficient for the body to walk this way).
All the values at the low end of the scale are there because they have
nice
high mean values. For example the
temporal-spatial characteristics are simple values whereas most
of the gait traces
oscillate about a baseline (often close to zero) and thus give low
mean signals.
You ask why is the cv higher at the ankle than at the hip. There is
a small increase in
true variability at the ankle but the primary reason that the cv is
so high is because
the mean value of ankle dorsiflexion is a lot lower than that of
hip flexion and knee
extension.
Or is it? Another criticism of the cv is that it depends on the baseline
chosen for
your measurements. Hip extension is a good example. The Davis/Kadaba
model uses the
plane containing anterior and superior iliac spines as a reference
for the pelvis
(there is no particularly good reason for doing this other than that
they are easy to
palpate). Mean hip flexion is therefore in the region of 15-20 degrees
and the cv tends
to be quite low. Winter however used the lab horizontal as the equivalent
reference
which gives a mean hip flexion of a few degrees of flexion and correspondingly
higher
cv values despite the fact that the true variability in the data is
similar. Thus
Winter's hip and ankle cvs tend to be similar because both have a similar
mean value,
whereas those which Chris has been so good as to calculate from the
data I supplied
show much greater "variability at the ankle". What is actually happening
is that the
variability is similar but my mean hip flexion is much greater than
mean dorsiflexion. (By the way Chris I think there has been a transcription
error in the yellow table, on page 27 of the 2nd edition of Winter's book
the values
for cv for intra-subject variability are quoted as hip 21, knee 8 and
ankle 16). [corrected now! - CK]
I can't see what is wrong with simply stating repeatability/variability
as the average
standard deviation of a parameter over the gait cycle. There
is no need to divide
through by the mean value. This gives a simple value in degrees
which is easy to
understand. It is also serves as a useful guide in interpretation.
As a rule of thumb,
if the difference in the signal you are seeking to interpret is less
than this average
standard deviation then you probably should not be reporting this as
significant. On a
statistical basis over a third of the able-bodied population will show
this difference
or greater. There is no equivalent with cv, which is convenient because
if we have no
easy handle on the repeatability on the data we can carry on interpretting
all the
features on our nice little traces without worrying whether they are
actually
significant or not!
Please let's bin the cv and stick to the average standard deviation
over the gait
cycle.
Richard
Richard Baker
Gait Analysis Service Manager
Musgrave Park Hospital
Stockman'sLane
BELFAST
BT9 7JB
Tel: +44 (0)1232 669501 ext 2155
Fax: +44 (0)1232 683816
Dear CGA subscribers
Further to Chris Kirtley's quandary:
> a. Ankle kinematics are most variable; and
> b. Ankle kinetics are least variable.
>
> How do you account for this seeming contradiction?
I believe that there is a simple explanation and it has to do
with
the statistic used, namely the coefficient of variation. We have
found (Vaughan et al., 1992) that the CV, which is the the sum of the
standard deviations divided by the sum of the means at each point in
the gait cycle, is inappropriate for evaluating signals that do
not
differ greatly from the cycle mean. (Think about the two
signals --
ankle angle and ankle moment -- referred to by Chris. The plantar and
dorsi-flexion angle "hovers" around neutral or zero degrees
throughout the cycle, whereas the moment moves from a small
dorsi-flexor value just after foot contact to a large plantar flexor
value of almost 100 Nm during push-off). A far more illuminating
statistic is known as the Variance Ratio (VR), first proposed
by
Hershler and Milner (1978), and used by Kadaba et al. (1985) and
Pierotti et al. (1991). We have described the statistic in some
detail (Vaughan et al., 1992) and I would urge Chris and others to
re-look at their data with the Variance Ratio. I'm willing to bet
that it will help him out of his quandary!
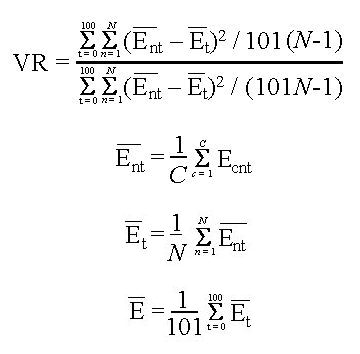
where t = time in the gait cycle (0... 100), n = subject number out
of total of N subjects, c is cycle number out of a total of C cycles, and
Ecnt is the amplitude of the measurement for cycle
c, subject n, at time t.
Yours in gait
Kit Vaughan
University of Cape Town
REFERENCES
Hershler C, Milner M (1978) Transactions in Biomedical Engineering,
25: 413-420
Kadaba M et al. (1985) Journal of Orthopaedic Research, 3: 250-359
Pierotti S et al. (1991) Journal of Orthopaedic Research, 9: 720-729
Vaughan CL et al. (1992) "What is the normal function of tibialis
posterior in human gait?" The Diplegic Child (edited by M Sussman),
American Academy of Orghopaedic Surgeons, Rosemont, IL, pp. 397-409
I agree totally with Richard. using SD is a much better idea
than
COV, especially as for most of the variables it is fairly constant
across the cycle anyway. COV is only statistically valid if the 2
signals being compared have very similar average values and very
similar patterns, in which case you are really just comparing the SDs
anyway.
This does not explain however why Winter's ankle COV differs from
the
current ones which I explained previously as a 2D vs 3D modelling
phenomenon. In 2D an externally rotated foot would appear more
plantarflexed but this effect would genrally be balanced by the
dorsiflexing effect of more associated pronation. In VCM you would
still have the pronation-induced variability, without the balance of
the parallax effect to counteract it.
Jeremy Linskell
Manager, Gait Analysis Laboratory
Co-Ordinator, Electronic Assistive Tehcnology Service
Dundee Limb Fitting Centre
Dundee, DD5 1AG, Scotland
tel +1382-730104, fax +1382-480194
email: j.r.linskell@dth.scot.nhs.uk
web: http://www.dundee.ac.uk/orthopaedics/dlfc/gait.htm
A few weeks ago, Scott Wearing asked a question as to why the coefficient
of
variation (CV) for the angle of gait was so high in some studies which
measured this parameter. I replied that I felt it was because
the absolute
values for angle of gait are low when measured from the line of progression,
since the CV will mathematically produce a larger value with lower
mean
values.
Cheers,
Kevin
Kevin A. Kirby, D.P.M.
Assistant Clinical Professor of Biomechanics
California College of Podiatric Medicine
Private Practice:
2626 N Street
Sacramento, CA 95816
Voice: (916) 456-4768 Fax: (916) 451-6014
Dear Richard,
I have a few comments to make on your submission to CGA:
Winter however used the lab horizontal as the equivalent reference
which
gives a mean hip flexion of a few degrees of flexion and correspondingly
higher cv values despite the fact that the true variability in the
data is
similar. Thus Winter's hip and ankle cvs tend to be similar because
both
have a similar mean value, whereas those which Chris has been so
good as to
calculate from the data I supplied show much greater "variability
at the
ankle". What is actually happening is that the variability is similar
but my
mean hip flexion is much greater than mean dorsiflexion.
What you say may be true; however, in Winter's lab (at least when I
worked
there) the hip knee and ankle joint angular displacements were set
to zero
in the "normal" anatomical position, ie, hip and knee at 180deg
and the
ankle at around 240deg or so depending on the angle created by the
lateral
malleolus to 5th metatarsal segment line. Thus, while the hip
angle range
was around 45-60deg, it went from about 25+ deg of flexion to 25+ deg
of
extension. Similarly, at the ankle, the range was reasonable
(don't have
the numbers in front of me) with about a third of the range or so in
dorsiflexion and the rest in plantarflexion. The knee joint was
entirely in
the flexion range, ie, 0 to 60+ deg. It would be interesting
to set the
mid-range of knee flexion to zero and then recalculate its cv.
By your
theory, its cv should increase since it would behave more like the
hip and
ankle.
Please let's bin the cv and stick to the average standard deviation
over
the gait cycle.
This may be a good suggestion, but bear in mind that today with more
labs
using so-called standard marker sets and similar commercial equipment
it is
easier to get consensus around an issue like this. When Winter
was
producing his 'classic' data in the 1980s, there was little standardisation,
particularly in presenting angular data (eg, full knee extension could
be
zero deg, 180 deg or occasionally somewhere in between!). I don't
think
Dave is a subscriber to CGA, but I am pretty sure that as Professor
Emeritus
at Waterloo he still is active and continues to correspond via his
university email. Chris, maybe you could elicit his input to
this debate?
I hate to try and put words in his mouth (if you know him, you would
know
that is quite impossible).
Cheers,
Drew Smith, PhD
Assistant Professor
The Hong Kong Polytechnic University
Dear all,
Chris wrote:-
I would have expected the ankle kinematics and kinetics to
also show the
least variablity (most consistency). In fact:
a. Ankle kinematics are most variable; and
b. Ankle kinetics are least variable.
How do you account for this seeming contradiction?
... the kinematic variability must somehow be arising from
the
motion analysis system....
If you think the kinematic variability is not artifact and
is a true
reflection of the biomechanics, please explain why the kinetics
do not
also show high variability.
The definition of a "kinematic artifact" is an interesting one. The
branches of classical mechanics are Kinematics and Kinetics. Thus the
only true kinematic artifact (one that is not experimental, e.g. due
to marker drift or insufficient spatial temporal data resolution) is
simply the branch of mechanics called Kinetics.
Kinematics is the branch of mechanics that deals with the geometry of
motion; for example the description of gears and cams. Thus
kinematics deals with the shape of the periphery of the body.
Kinetics is the branch that deals with the theories of motion, such
as Newton's laws. These laws are mass centered (kinetic and
gravitational energy based; motion is referred to the center of
mass, or center of gravity).
The concepts are linked by Newton's second law which defines "force"
as the product of (Kinematic acceleration) x (Kinetic mass).
Incidentally no one has ever seen a "force", merely the effects of
such a postulate.
The kinematic and kinetic artifacts are never simultaneously zero.
an observation confirmed by all available data.
(1) If we force the kinematic artifact to zero,
then the kinetic artifact become infinite.
(2) If we force the kinetic artifact to zero, then the kinematic
artifact become infinite.
In both cases (zero x infinity) is undefined mathematically.
In the biomechanical problem, this means that the "force" is
undefined.
The solutions are:-
(1) if we know everything about the kinematics of the body, i.e. if
we knew exactly how each component fitted into the others, the use
of Newton's laws is superfluous, because force is an undefined
concept. (Technically, if we knew how the body works exactly, we would
have no need for gait analysis :-).
(2) if we knew everything about the kinetics of the body, i.e. if we
knew its exact postion and momentum, then we would have no idea of
its kinematic cause (its force generating capacity, or how it works).
This prediction should come as no surprise because modern particle
physics (which ignores the shapes of the particles) informs us that
this is the correct answer. In the biomechanical case, this simply
means that we have no knowledge of the shape of the body because it
is being treated as a single mass center.
There is no experimental error in either case (1) or (2).
The error arises from an incorrect theoretical origin.
---o0o---
Chris continues:-
... note... that ankle kinetics are almost
independant of kinematics, being almost completely
determined by the ground reaction forces.
I would suggest, rather, that the ground reaction force is determined
by the ankle kinetics, not as Chris suggests vice versa.
There is much discussion centered on the "ground reaction force" in
gait analysis. But there is never any mention of its conjugate
"Body
Action Force" in the literature.... This is surprising because
the
body action force is persumably what we are all searching for in the
mechanical description of gait!!
According to Newton III, for every action there is an equal and
opposite reaction. The "body action" is clearly causal, and the
reaction, well, merely a reaction; an incomplete one at that,
otherwise we would all move in straight lines. Hence the Body Action
Force does not obey Newton's laws.
Identifying the properties of the body that create the "Body Action
Force" should be our main concern. That is we should be paying close
attention to the "kinematic artifacts".
The existence of a "Kinematic artifact" is merely a matter of
perspective. There also exists a "Kinetic artifact". They are linked
by the assumption that "Newton Rules Biology". (Again I must
emphasise the contents of a previous posting that Newton himself
never claimed his laws applied to human bodies).
The recognition by the CGA group that there ARE irreducible
kinematics artifacts, is essentially scientific evidence that
Newton's laws DO NOT apply to all bodies, particularly the human
body. Let us not hide this important scientific discovery under
the
name of "error".
The so called "CV error" or "kinematic artifact" or "kinetic
artifact" (the latter being a contravention of the law of
conservation of energy) is not an instrumental or experimental
error at all. It arises from the error of the theoretical claim that
Newton's laws of mass centered kinetics apply to all bodies at
sub-light speeds, defined without due regard to their anatomical form
or kinematic shape.
To support this claim, I propose that there is experimental evidence
in the literature for the existence of a kinetic artifact
(i.e. contravention of the law of conservation of energy) that arises
from a kinematic artifact.
[Reference 1] Interrelationships between mechanical power, energy
transfers, and walking and running economy. Medicine and Science in
Sports and Exercise, 25:508-515, 1993.
This study used five different biomechanical methods, to produce
one, AND ONLY ONE, significant finding: A correlation exists a
runner's speed and their efficiency, if and only if the association
of kinetic and gravitational potentail energy is IGNORED in the
KINEMATIC calculations. All othere methods produced indifferent
results.
For an explanation of this statistically "rare event", a false
positive, we are referred to the article [Reference 2] Power
equations in endurance sports, Journal of biomechanics, 23:857-315,
1990.
Here in a section discussing the problems in applying classical
mechanics, we read on page 869, column 2 half way down:
"This result is false*[sic] since we know from Newton's second law
that F=mg and that the rate of change of potential energy is not zero
as the equation would predict."
*It is unclear precisely why this result is declared false,
especially given that it has just been derived. Thus it would
appear that the "problem with classical mechanics" is ultimately
that the equation declared "false" is the classic law of conservation
of energy.
This declaration creates a circular argument. Reference[2]makes an
erroneous assumption, then reference [1] proves experimentally that
this incorrect assumption is clearly true. (There is no experimental
error in this process, and if we believe what we read apparently no
theoretical error either; merely "problems").
All the endless talk of "experimental error", in gait analysis hides
that basic fact--there is a basic error in the theory.
The expectation though is always that the data is always incorrect
and the theory always correct.
The error is in the theoretical approach. Hence, we end up
perpetually tackling, but never solving the problems of our own
making :-(
It is kinda sad that as scientists we have lost respect for our own
data.
Thus we should not be too critical of the "experimental errors" or
CV's that lead us to the "incorrect result". Particularly when our
basic starting assumption is wrong. That assumption is that, in
biomechanics, the laws of Newton can be applied in explicit
contradiction of the law of conservation of energy.
Remove this error first, then all the existing data will begin to
make sense.
This basic error is revealed through the rigorous application of the
kinematic method and statistical methods in reference [1].
Discussion should focus on how these "kinematic artifacts" are
produced by the anatomy. They are the clue to the nature of the body
action force.
The compilation of a Gait analysis database will help resolve these
issues, because the different methods of producing the same error
over and over again will sooner or later have to be reconciled.
Craig Nevin
Anatomical Engineer
Dear Chris and friends,
Sorry for not being alert when the discussion on CV started.
Isn't it a basic rule in data processing, not to use
ratios unless we
have a ratio scale? Obviously angles are measured on an interval
scale with
an arbitrarily chosen zero point. Therefore this problem has a more
general
aspect in addition to whether CV is an appropriate measure of
repeatability. Not only should we avoid CV here, but the computation
of
percentages and all other ratios.
I wonder if this may pose more problems when using other
common
statistical measures where the mathematics is not as intuitive to the
layman as in this case. Do we really know when a statistical measure
is a
ratio and thus should be avoided on interval data? I suspect this is
an
area where a lot of misinterpretation may have passed unattended.
Regards from wintry Norway
Rolf
_____________________________________________________________
Rolf Moe-Nilssen, MS,
PT, Research fellow, Division of Physiotherapy Science,
Department of Public Health and Primary Health Care, Faculty of Medicine,
University of Bergen, Ulriksdal 8c, N-5009 Bergen, Norway,
voice:+47 55 58 61 70, fax:+47 55 58 61 30
Dear Subscribers:
May I add my ideas to the CV discussion?
According to my little knowledge, the CV is a parameter to represent
the degree of
dispersion(variability) of sampled data, which may have a similar meaning
to S.D. or
standard error and so on.
But CV may have two advantages over S.D.
i) Because CV is SD divided by mean, it is dimensionless.
So, it can be used to
compare the variability of two groups with different units, such as
body weight vs
height, joint angle vs moment.
ii) In addition to the merit of dimensionlessness,
it can overcome the tendency of
S.D. increment with increasing mean value. If we assume that
adult elephants and adult
males have similar degree of dispersion(variability) on their body
weight, the S.D. of
elephants body weight must be much bigger than that of men. In this
situation, we
should use CV rather than SD.
Mr. Baker said : I can't see what is wrong with simply stating
repeatability/variability as the average standard deviation of a
parameter over the
gait cycle. There is no need to divide through by the mean value.
So, I do not think that Mr. Baker's above idea would be so good. VR
of Dr.
Vaughan may be better.
Then, what would be the reason for Dr. Kirtley's observation as below?
Dr. Kirtley wrote:
I would have expected the ankle kinematics and kinetics to also
show the
least variability (most consistency). In fact:
a. Ankle kinematics are most variable; and
b. Ankle kinetics are least variable.
The CV is no more than the degree of dispersion, it includes
both
of inter-subject
variability and test retest(inter-test) variability. In gait
analysis data of a certain
sample size, the CV can be made of inter-subject variability of true
value which God
assigned to each man and inter-test variability with some error made
by men or
equipment.
Here's my assumptions.
i) The absolute variability (SD, not CV)
of true value-God assigned, may increase or
decrease in proportion to the size of mean value like body weights
of elephants and
men.
ii) The absolute variability of error introduced
when detecting the true value will
not be in proportion to the size of mean value. It may have
inverse relationship or
other, depending on the detection and calculation methods.
So, if the mean of a sampled data and inter-subject variability would
be relatively
small to inter-test variability, the CV may amplify the inter-test
variability. In this
case like ankle kinematics, Mr. Baker's comment to use SD rather than
CV should be
true.
According to my assumption, the SD by inter-subject variability of ankle
kinematics may
be smaller than that of hip or knee and SD by inter-test variability
of ankle may not.
So, if we calculate the CV by dividing the sum of both SD with mean
value, the CV may
increase with decreasing the size of mean value.
This assumption may meet the comment by Dr. Vaughan as below.(Hope
I am right.)
the CV, which is the sum of the
standard deviations divided by the sum of the means at each point
in
the gait cycle, is inappropriate for evaluating signals that do
not
differ greatly from the cycle mean.
The smaller CV of ankle kinetics than that of hip or knee may be
explained mainly by
the inverse dynamic calculation proper, that is, SD by inter-test
variability.
We may dissociate the two kind of variability from CV by constraining
one in fixed
value such as getting CV from multiple trials of a man. But it will
never be completely
fixed because of day to day, diurnal, stride to stride ... ...
variation.
About Rolf's comment:
Isn't it a basic rule in data processing, not to use
ratios unless we
have a ratio scale? Obviously angles are measured on an interval
scale with
an arbitrarily chosen zero point.
I do agree with Rolf that we should use the ratios in a ratio scale.
But are the
angles interval scale?
I think the angles we measure in gait analysis are a kind of ratio
scale which have
absolute "zero". For example, 60 degree of angle is 2 times bigger
than 30 degrees of
angle and 90 degree of anlges is 2 times bigger than 45 degree of angle.
The ratio of
60degree and 30 degree is just same as that of 90 degree and 45 degree.
Sincerely,
from Sun G. Chung in Korea
All interested in this debate,
What is your reaction to the following suggestion?
If you want to go beyond an inspection of the variability of one set
of data
and are interested in making statistical inferences about differences
between
two sets of time series data you could consider the following:
The mean value for a variable, its standard deviation, and 95% confidence
interval (95% confidence interval = 1.96 x standard deviation/sqrt(n))
can be found for each percent of the cycle. The question of significant
difference between one subject or one condition and another can be
answered by
plotting the curves representing the mean values of the variables together
with the mean plus and the mean minus the 95% confidence interval.
If there is no
overlap of the 95% confidence intervals at all then the two time series
could
be said to be significantly different. Wherever the curves are separated
by
more than twice the 95% confidence interval for more than five consecutive
data points the conclusion could be reached that the curves are significantly
different at that point.
A counter argument is that 100 t-tests are being conducted simultaneously
in
this process and one could expect that a false result could
occur 5% of the
time, that is, at five data points. These false results, however should
occur
randomly through the data so it would be very unlikely that all five
would
occur consecutively in the data. Therefore only claiming significance
when the
difference exists for more than five consecutive data points
is a conservative
approach.
Cheers to all,
Richard
Richard Smith
Research Manager, School of Exercise and Sport Science
Faculty of Health Sciences,
The University of Sydney
voice: +61 2 9351 9462
East Street, Lidcombe, NSW 2141
fax: +61 2 9351 9204
AUSTRALIA
http://www.cchs.usyd.edu.au/Academic/ESS/smith/richard.html
Interesting debate. About CVs. People may wish to look up a couple
of
references I found concerning treatment of curved data. The
stats
gets very heavy, so any statisticians out there any comments would
be
welcome. The curved data studied includes knee and hip motion, and
angle-angle diagrams.
Rice JA and Silverman BW. Estimating the mean and covariance structure
nonparametrically when the data are curves. Journal of the Royal
Statistical Society, 53(1), 1991.
Ramsey JO and Dalzell CJ. Some tools for functional data analysis.
Journal of the Royal Statistical Society, 53(3), 539-572, 1991.
Leurgans SE, Moyeed RA, Silvermann BW. Canonical correlation analysis
when the data are curves. Journal of the Royal Statistical Society,
55(3), 725-740, 1993.
Jim Richards
Lecturer in Biomechanics
Department of Rehabilitation
University of Salford
http://www.salford.ac.uk/prosthetic/homepage.htm
http://146.87.238.80/biomech.htm
Dear all,
As my colleague, Drew Smith, suggested, I detrended the angle plots
by
subtracting the mean from every point (I left the SD unchanged). I
then
recalculate the CV. I used Winter's 2D data from his book.
Result... Knee CV was 22% before detrending, 33% after! The ankle (70%)
and hip joint CVs were relatively unchanged by the process:
Before After detrending
Hip
51
57 %
Knee
22
33
Ankle 71
70
Interesting! However, the knee is still much more consistent than the
other two joints.
I then worked out the average SD, as suggested by Richard:
Average SD
Hip
6 degrees
Knee
5
Ankle 4
Voila! Roughly the same SD at each joint.
I think the conclusion from this is that the CV is, indeed, less than
satisfactory as a means for comparing variation between different joints
or variables. I'd like now to try Kit's suggestion of the Variance
Ratio. I'm afraid we don't have any of the journals mentioned in our
library. Can someone (Kit?) let me know the formula?
Have a nice weekend. I'm going fishing to forget about all these CVs!
Chris
--
Dr. Chris Kirtley MD PhD
Dept. of Rehabilitation Sciences
The Hong Kong Polytechnic University
I thought I'd ask my old mathematician (and drinking partner) in
Australia about our CVs problem. Also asked him his view on Kit's
suggestion of the Variance Ratio - I've put the formula for
this at:
/teach-in/cv/responses.html#Kit
It's interesting that he confirms that simply ignoring the sign of the
means is not acceptable, so the original definition suggested by David
Winter is, indeed, flawed. Here's what he says...
In the first instance, CVs are only meant to be used with only positive
or only negative data. To use absolute values is not adequate.
If your
summation index means timepoints over gait cycle (100 points or so)
amplitudes near a zero-crossing have practically no influence
on the average which is dominated by large values. Apart from some
doubts about the meaning of this average, suppose for the sake of
simplicity all variances equal. The consequence will be that for
measurements with some large amplitudes (big variation during the cycle)
the CV will be reasonably small. For measurements with only small
amplitudes you would obtain larger CV's (relative to the between
subjects variances of course). Kit Vaughan's VR is practically a
loan
from repeated measurement Anova and ICC. In case of only one
cycle the
nominator is just the between subject variance and the denominator
the
residual variance (in the given formula it probably should read for
the
denominater E bar instead of Et bar to make sense).
As with the CV the distributional properties of the VR are difficult
to
assess due to autocorrelation. With traditionally small sample
sizes the
correlation structure probably cannot be estimated and may depend
heavily on subject conditions beyond control.
In all, I agree with one of the contributors (Richard Baker) to bin
the
CV altogether.
Any suggestions? Well, and that could answer another question by one
of
the correspondents as to compare two such gait measurements series.
If
there is something like a standard gait series then take the difference
and test for white noise via Kolmogoroff-Smirnov which (appropriately
adjusted) would supply through its test criterion confidence limits
for
the whole curve as well as a coefficient of fit.
Cheers and prost
Juri.
Dr. Jurgen P. Sommer
Curtin University
Selby Street
Shenton Park
Western Australia 6008
Phone: +61 8 9266 3620
Fax: +61 8 9266 3636
--
Dr. Chris Kirtley MD PhD
Dept. of Rehabilitation Sciences
The Hong Kong Polytechnic University
Dear all,
Chris Kirtley wrote:
3. I confess that I'm not enamoured by Richard Smith's suggestion,
which seems a bit arbitrary and empirical, but I see his point.
My own
inkling would be, rather than try to look at the whole curve, to
pick out
various key measurements, e.g. maximum swing knee flexion, maximum
plantarflexion, total push-off energy, etc. We could then use
'standard' measures of variation and reliability, such as the ICC.
We certainly look at important discrete points in the gait cycle as
a
matter of course. However, discrete points don't tell the whole
story
about the pattern of movement or the points adjacent to those
discrete points
of interest. Further, by focussing on the usual measurements we could
miss
out on new information which might change the way we think about the
mechanisms of walking.
I have no problem with being empirical but we evaluate whole curves
in
relation to the development of models and theories as well. As
for
being arbitrary I can't see what is arbitrary about proposing a hypothesis
about differences in movement patterns among a number of pathologies
and then
testing this hypothesis using the method I suggested.
I will get the references referred to by Jim and Michel and hopefully
improve our methods.
Thanks for your responses,
Cheers,
Richard
Richard Smith
Back to
Teach-in