
I'll start with the disclaimer that our lab does not ensemble patient data on a regular basis. Having said that, I'd be glad to give my input.
I'll assume that the ensemble analysis averages a point from one trial
at, say, 30% of the gait cycle with the same point in the other trials.
If something like a peak flexion is the point of interest in a particular
curve, the peak may not lie at exactly the same timing in the gait cycle
in each trial. The peak flexion of the ensemble average is therefore
not mathematically identical
to the average of the peak flexion of each trial.
All other factors being equal (marker placement, etc), the more accurate method would have to be the second, i.e., the average of the individual peak flexions. I'm not overly confident that I can identify the gait cycle events exactly the same in each trial, and I do not trust the autocorrelate functions. These factors will add to inaccuracy of the ensemble average.
Lanie Gutierrez
Gait lab engineer, PhD Student
Karolinska Hospital, Stockholm, Sweden
This is a great question. I am curious if someone has actually done it both ways and compared the results. That would be the best way to answer the question.
When I thought about this before I concluded that the second method (extract gait parameters from each gait cycle) should be more correct, but that for most applications the difference is so small that it would not be worth the extra trouble.
Your specific questions:
> 1) Would the mean and SD calculated for a given selected point (e.g.
peak
> knee swing flexion) be identical if it were calculated by the second
method
> as opposed to the original, ensemble averaging method?
Ensemble averaging will always lower the peaks and introduce temporal blurring, because events do not occur at the same time in different cycles. So you will get a systematic underestimation of peak values. This could be a problem if there is large variability in event timing between gait cycles. On the other hand, estimating peaks from individual cycles will systematically overestimate the true peak value, because there is always noise on the curves. Ensemble averaging will reduce the effect of noise on peak values.
How each technique would affect the SD is not immediately obvious to me.
> 2) If not, then which technique is the more mathematically correct?
If noise is not big enough to cause errors, I would say that the second
technique is more correct because it does not rely on the
assumption that events occur at the same time in each gait cycle. However,
usually that assumption is quite good. Also, right at
the peak, the ensemble average is not very sensitive to timing of the
peak because the derivative is zero at that point. So it is
probably not worth the extra trouble to implement the second method.
I have not really thought about gait parameters other than peak values, though.
Another aspect that may be relevant is the subsequent statistical analysis.
If all you have is a mean and SD from an ensemble
average, you will probably do a statistical test based on the assumption
of a normal distribution (e.g. more than 2*SD from the mean of healthy
subjects is labeled as abnormal). If you had extracted the gait parameters
from each gait cycle, you could actually find out what the statistical
distribution is to better choose/justify the
statistical tests.
Ton van den Bogert
--
A.J. (Ton) van den Bogert, PhD
Department of Biomedical Engineering
Cleveland Clinic Foundation
9500 Euclid Avenue (ND-20)
Cleveland, OH 44195, USA
Phone/Fax: (216) 444-5566/9198
An interesting topic.
1) Would the mean and SD calculated for a given selected point
(e.g. peak knee swing flexion) be
identical if it were calculated by the second method as opposed
to the original, ensemble averaging
method?
No. The mean and SD calculated by the 2nd method are defined relative
to the amplitude of peak knee
flexion independent of timing.
The mean and SD calculated from the first method (EA) are defined relative
to the average timing of
peak knee flexion. As it is unlikely that peak knee flexion will occur
at the same % of the cycle for all
trials the mean calculated by the EA method will underestimate the
true peak knee flexion and the SD
should also be greater for the EA method than the alternative method.
I say should because on data for one subject that I calculated means
and SD's for from both methods the
SD was slightly smaller for the EA method.
DATA
21 year old male walking at self-selected natural gait velocity. Data
was normalised to a percentage of the
swing phase (FO = 0 %, FC = 100 %)
Peak knee flexion (rads) @ % of swing phase
Method 2 (Individual trial peaks)
Mean: -1.0655
SD: 0.0218
Timing of peak knee flexion (% of swing)
Mean: 35.2
SD: 0.8367
So for this data set the peak knee flexion calculated by the EA method
is an average of the magnitude of
knee flexion at 35 % of the swing phase (35.2 rounded down) and therefore
for those trial in which peak
knee flexion did not occur at 35 % of swing, the peak will be under-
represented. I would hypothesise
that the slightly lower SD for the EA method is not a true indication
of what would happen if these 2
methods were applied to many subjects however I don't have the time
at present to test this hypothesis :-(
2) If not, then which technique is the more mathematically correct?
I think that both techniques are mathematically valid, however for clinical evaluation I would think more information can be gained from looking at both the mean and SD of the magnitude and timing of the relevant biomechanical variables and comparing these to a normative database.
I should state that my experience in gait biomechanics is from a research not clinical perspective and therefore this comment is not based on practical experience.
Regards,
Pete
Peter Mills
Biomechanics-Dynamics Group
School of Physiotherapy and Exercise Science
Griffith University
Gold Coast PMB 50
Gold Coast Mail Centre 9726
Queensland Australia
Ph: +61 7 5552 8357 Fax: +61 7 5552 8674
Email: p.mills@mailbox.gu.edu.au
Don't think this debate should proceed much further before you've all
had a chance to read Gait Posture 2000 Dec;12(3):257-64. Reduction
of gait data variability using curve registration. Sadeghi H, Allard
P, Shafie K,
Mathieu PA, Sadeghi S, Prince F, Ramsay J. Abstract and link
to full text at
:
http://www.ncbi.nlm.nih.gov/entrez/query.fcgi?cmd=Retrieve&db=PubMed&list_uids=11154937&dopt=Abstract
The paper addresses exactly this issue with regard to muscle powers
which are resolved into components in the different planes (but that's
a whole different discussion). It shows, amongst other things that H1 muscle
power (sagittal) is 20% lower when calculated from ensemble averaged data
than by taking the average of the H1 peaks from individual trials.
The paper then
goes on to propose an exceedingly sensible alternative strategy for
time normalising data to get around this.
If there were more than 24 hours in the day I'd have worked on introducing these methods into our clinical practice by now.
Richard
Richard Baker PhD CEng
Gait Analysis Service Manager and Director of Research
Hugh Williamson Gait Laboratory
Royal Children's Hospital
Flemington Road,
Parkville
Victoria 3052, Australia
Adjunct Associate Professor, Schools of Physiotherapy and Human
Biosciences, La Trobe University
Honorary Senior Fellow, Department of Mechanical and Manufactuing
Engineering, University of Melbourne
Tel: +61(0)3 9345 5354
Fax: +61(0)3 9345 5447
e-mail: bakerr@cryptic.rch.unimelb.edu.au
Ray forwarded me your question in regard to normalisation and the use of derived variables in gait. I have no real interest in the assessment of gait but I do have an interest in EMG profiles and motor control - the same issues raise their ugly head - basically we collect so much data (in EMG and gait analysis) that we are able to post process in so many different ways we have a problem of missing the clinical reason why one is actually doing the assessment.
[I was going to ask the Biomech-L group about the evidence for the clinical
utility of some of the derived methods / variables.
For example, at what point does a specific parameter force a change
in the clinical decision making process]
Anyway to answer the question one needs to revert to the reason why the data is being collected. Here is a test of validation for you that may assist in the decision of which derived variable to select. You get two groups of subjects where we can be [clinically] confident that there is a clinical difference. You could get a group of normals test them and then place a brace / weight on the lower limb. You perform the assessments and derive the variables.
You then perform a statistical test of within subject comparison and
have a look at the effect size (essentially the p value). One
would expect that the derived variable of value would be sensitive
to the clinical difference we can observe. Indeed the level of confidence
of (p value) gives an indication as to the ability of the processing protocol
to differentiate between groups. The level of confidence does not need
to reach statistical significance since this is associated with the power
of the analysis but if one derived variable is p = 0.06 and the other p
= 0.23 then you can be confident that the first is more sensitive (and
statistically more powerful) than the second.
I used this technique in describing different methods amplitude normalisation
for EMG. Some use the coefficient of variation
(CV) as a measure of removing within group variance (Winter and Yang)
- however it is plausible that the reduction in variance
may also reduce the true biological variance. If the CV is combined
with the effect size (p-value technique) then it is clear that there
is an advantage in certain amplitude normalisation protocols. I have that
reference for you if you wish.
Anyway getting to your mathematics question.
Mean of the individual ensemble averages is equivalent to the mean of all trials The SD of the individual ensemble average is not equivalent to the SD of all trials placed together.
Therefore the use of the 2 techniques will generate same means but variance in the data set will change (I think) This impacts on the interpretation of the clinical and statistical differences.
This is particularly true for an unpaired test (two groups). With a
within group comparison you may choose to select change
scores or other analysis technique
... for example.. I would suggest using a analysis of covariance (ANCOVA)
i.e a regression model where the initial value is
used as the covariate. This provides greater statistical power
and is able to standardise the initial difference between groups.
Vickers AJ, Altman DG 2001 Statistics notes: Analysing controlled trials
with baseline and follow up measurements. British
Medical Journal 323:1123-1124.
Just a few thoughts.
cheers
Garry.
ps. Hopefully we have a large number of trials where we can be confident
in the utility of SD. Otherwise we may wish to
consider the Median value or some truncated mean process. I have seen
SD calculated from 3 trials - ....Then again one
could use the effect size analysis to see if the median is more applicable
than the mean assessment protocol.
Cheers
Garry T Allison Associate Professor of Physiotherapy
The Centre for Musculoskeletal Studies http://www.cms.uwa.edu.au/
Department of Surgery, The University of Western Australia.
Level 2 Medical Research Foundation Building
Rear 50 Murray Street
Perth Western Australia 6000.
email <gta@cms.uwa.edu.au>
ph: (618) 9224 0219
Fax (618) 9224 0204
But, from the statistical definition, I am unsure if the EA method Standard Deviation is “correct” (emphasis on the quotes).
My understanding is for a correct standard deviation, the data points must be independent, but when using the EA method, the SD calculated at any time (t) as compared to the previous or next time point (t+1 or t-1) are not necessarily independent.
Basically, gait data is time series data, and I remember my statistics professors emphasizing that other analysis methods were needed in such cases.
But I assume this only applies to comparisons between time points within
the EA (for example peak at heel strike compared to
peak at toe off).
Now does it matter? I don’t know, but if you’re going to do the stats, then I would assume it does.
Cheers,
Bryan
We looked at our time-series data to see when
a selected point in the gait cycle occurs per stride
and per trial (ie, ensembled averaged strides).
So, for peak swing knee flexion, we found for three strides:
Ensembled Averaged = 70.6 +/- 2.2 @ 83% gait
cycle
per Stride = 71.1 +/- 1.7 @ 81.7 +/- 1.5 %
gait cycle
1) Would the mean and SD calculated for a given
selected point (e.g. peak knee swing flexion) be
identical if it were calculated by the second
method as opposed to the original, ensemble
averaging method?
For the most part, no, due to the fact that
the timing of when a given point occurs (ie, peak
knee swing flexion) will usually be different,
even for a very consisitent walker.
2) If not, then which technique is the more
mathematically correct?
I would say the second technique is statistically
correct because it addresses the real issue, which
is the magnitude of the selected point independent
of timing. Furthermore, the "size" of the time of
occurrence of the selected point for a given
number of strides is indicated with the second method
whereas it is assumed when strides are ensembled
averaged. As seen in the above results, there
is no significant difference between the magnitudes
of both methods but the timing range (for one
SD) is known with the per stride method.
I've found this to be an advantage, particularly in research,
and some of my clinical colleagues have asked
for this as well.
Thanks and good luck - Arnel
lllllllllll Arnel Aguinaldo, MA, ATC
(.)**(.) Bioengineer, Motion Analysis
Laboratory
!.
Children's Hospital San Diego
-U- Tel: 858.966.5807
[aaguinaldo@chsd.org]
Online: www.sandiegogaitlab.com
Therefore, I cannot see many circumstances (in research) where ensemble averaging would be appropriate. I suppose that when a qualitative impression is all that is desired, then ensemble averaging may be acceptable.
Chriss Stanford
Christian Stanford, MA ATC CSCS
Orthopedic Research Associate
Motion Analysis Laboratory
Children's Hospital and Health Center
Mail Code 5054
3020 Children's Way
San Diego, CA 92123
cstanford@chsd.org
phone: (858)-576-1700 ext.3186
fax: (858)-966-7494
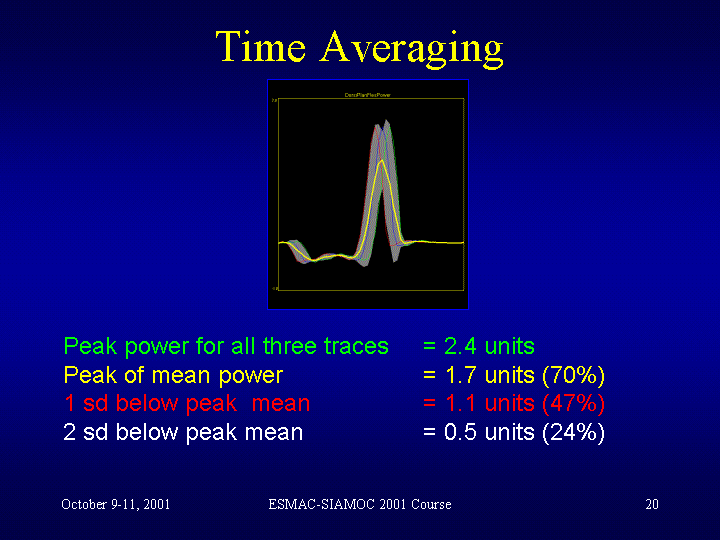
 The
attached slide (click to enlarge) is from some teaching material I prepared
for the last
Weird eh!
Richard
Richard Baker PhD CEng
Gait Analysis Service Manager and Director of Research
Hugh Williamson Gait Laboratory
Royal Children's Hospital
Flemington Road,
Parkville
Victoria 3052, Australia
Adjunct Associate Professor, Schools of Physiotherapy and Human
Biosciences, La Trobe University
Honorary Senior Fellow, Department of Mechanical and Manufactuing
Engineering, University of Melbourne
Tel: +61(0)3 9345 5354
Fax: +61(0)3 9345 5447
e-mail: bakerr@cryptic.rch.unimelb.edu.au
Now we are calculating about the conditions of continuous clinical gait analysis. Could you answer the following questions:
We calculate also the angular velocities of the body segments
based on the coordinates of three arbitrary not colinear points
of a
segment. The results are in the coordinate system of the points
(measuring coordinate system). We developed an Excel workbook
to calculate and demonstrate the angular velocity vector. For use of
this program you need only the following coordinates for the
investigating time interval: time (msec) x,y,z coordinates (mm) of
the mentioned 3 points.
one more additional question: would somebody like to try this software?
KL
Laszlo Kocsis, PhD
associate professor
Budapest University of Technology and Economics
Department of Applied Mechanics
Head of Biomechanical laboratory
I believe that the answer to your first question regarding the relative
agreement between statistics derived from
ensemble averaged curves versus statistics derived from individual
curves will depend almost entirely on the degree of within-patient
variability. The discrepancy between methods becomes
exacerbated if the
clinician wishes to establish normative values for a group of
patients.
Consequently, we've chosen to utilize both methods of averaging, but
for
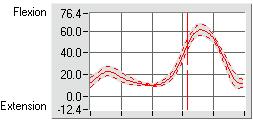
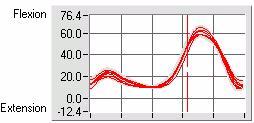
different purposes. When presenting waveform data, we utilize
ensemble
averaging, but only to provide the clinician with a sense of the trends
presented in the gait cycle. We also present this data in two
forms: a
plot with all raw curves present, and a plot with the curve and standard
deviation lines surrounding the curve. This way, the clinician
can
determine if any of the gait cycles can be considered 'outliers' prior
to looking at the ensemble average and standard deviation plot.


We calculate the descriptive statistics by obtaining the information
from each waveform (i.e. peak flexion during swing, and time of peak
flexion during swing) and using this data to calculate the mean and
standard deviation for each parameter of interest. As a result,
we then
know the true variability associated with the peaks (or whatever
parameter is chosen) and the variability associated with the time at
which the peak (or other event) occured. We use the data derived
in
this manner to make quantitative comparisons between patients or between
trials. My personal belief is that this is the appropriate statistical
method for making quantative evaluations of gait-cycle data.
I suppose that both methods can be considered 'correct', even
though
the discrepancy between results can become substantial if the patient
of
group of patients is extremely variable. For us, it's a matter
of
selecting the right tool for the task at hand.
Jim Richards
Professor
University of Delaware
Health and Exercise Science
<jimr@udel.edu>